
Introduction: Website speed isn’t just a technical nicety – it has a direct impact on your business’s success. A slow site can frustrate users, harm your search engine rankings, and even cost you sales. Studies have shown that even a one-second delay in page load can lead to about a 7% drop in conversion rates and 11% fewer page views Moreover, nearly 40% of shoppers abandon a website that takes more than 3 seconds to load, which means lost revenue and a poor first impression. Google also uses page speed as a ranking factor in its SEO algorithm, especially with the introduction of Core Web Vitals that measure real user performance. In short, speed matters for SEO, user experience, and conversions – a fast site keeps visitors happy and engaged, while a slow site sends them to your competitors.
In this comprehensive guide, we’ll explore 10 common reasons why your website might be slow and how to fix each one. Whether your site runs on WordPress, Shopify, or a custom codebase, these issues (and solutions) apply. We’ll explain each issue in clear terms, discuss how it affects performance, show you how to identify it (with tools like Google PageSpeed Insights, GTmetrix, etc.), give examples for different platforms, and provide step-by-step fixes including tool suggestions (e.g. caching plugins, Shopify apps). Let’s speed up your site!
1. Inadequate Web Hosting (Slow Server Performance)

One of the most common culprits for a slow website is the web hosting server itself. When someone visits your site, their browser communicates with your server to retrieve the content. If your server is slow or overloaded, it will take longer to respond, causing every page on your website to lag. Cheap or entry-level hosting plans (especially shared hosting) often mean your site is sharing resources with many others, leading to poor performance. In a shared hosting environment, your website can end up “waiting in line” behind other sites on the same server. This results in a high Time to First Byte (TTFB), where users experience a delay before the page even begins to load.
How it affects performance: A slow server increases the base response time for every request. Even if the rest of your site is well-optimized, a sluggish server will make the loading process feel slow. Visitors might notice that everything on your site is delayed (navigation, images, content), which often leads to frustration. In extreme cases, if your server is underpowered or misconfigured, it may even time out or fail to load pages during traffic spikes.
How to identify it: You can check if your hosting is a bottleneck by measuring server response times:
- Use tools like Google PageSpeed Insights or GTmetrix to see if “server response time” or TTFB is flagged as an issue. For example, PageSpeed Insights might say “Reduce initial server response time” if your TTFB is high.
- Perform a simple test by loading a very basic page (or a plain HTML page) on your site. If even a nearly empty page is slow, it points to the server.
- Use a service like Pingdom or WebPageTest to test your site from different locations. If all locations show a long wait before the page content starts streaming, the server is likely the issue.
- Check with your host if they have any CPU/RAM usage metrics; if your site often hits resource limits, that’s a sign the hosting tier is insufficient.
Examples:
- WordPress: If your WordPress site is on a low-cost shared host and you have moderate traffic or heavy plugins, the server may struggle. WordPress pages are generated via PHP/MySQL each time (unless cached), so a weak server makes this slow. You might see a 1-2 second delay before anything happens.
- Shopify: Shopify is a hosted platform, so you don’t manage the server directly. Generally, Shopify’s infrastructure is robust, but very high-traffic stores on lower plans might notice slower load at peak times (Shopify handles scaling for you to an extent). In most cases, hosting won’t be the issue for Shopify stores – bottlenecks are more often in theme/apps (covered below).
- Custom-coded sites: If you run a custom site on your own VPS or dedicated server, an underpowered machine or poor server setup can slow it down. For instance, running a resource-intensive application on a small single-core server will cause slowness. Lack of optimizations like PHP opcode caching or old hardware could also hurt performance.
How to fix it:
- Upgrade your hosting plan: If you’re on shared hosting, consider moving to a higher tier or a VPS/cloud hosting. For WordPress, specialized managed hosting (like WP Engine, SiteGround, etc.) often yields better speed. Ensure your server has enough RAM and CPU for your traffic.
- Choose a better host: Not all hosts are equal. Look for hosts known for performance. A quality host will serve pages faster thanks to better hardware and configurations.
- Enable server-side caching: Many hosts or setups allow caching at the server level (e.g., using Redis or Memcached, or static site caching). This can dramatically reduce the work the server must do per request.
- Optimize server configuration: If you manage the server, ensure you’re running the latest software (e.g., PHP 8.x for WordPress, which is much faster than PHP 5.x), and that things like GZIP compression and HTTP/2 or HTTP/3 are enabled. Also, use an optimized web server (NGINX or LiteSpeed can serve WordPress faster than a basic Apache setup).
- Plan for traffic spikes: If high traffic is expected (see reason #10), consider load-balanced or scalable infrastructure. For instance, use cloud services that auto-scale, or at least be ready to increase resources during big events.
- Use a monitoring service: Implement uptime/performance monitors (like New Relic, Pingdom, etc.) to get alerts on server slowdowns. This helps catch issues early.
By ensuring your hosting is adequate, you set a strong foundation. A fast server means the rest of your optimizations can truly shine, rather than being held back by an underpowered engine.
2. Not Using a Content Delivery Network (CDN)
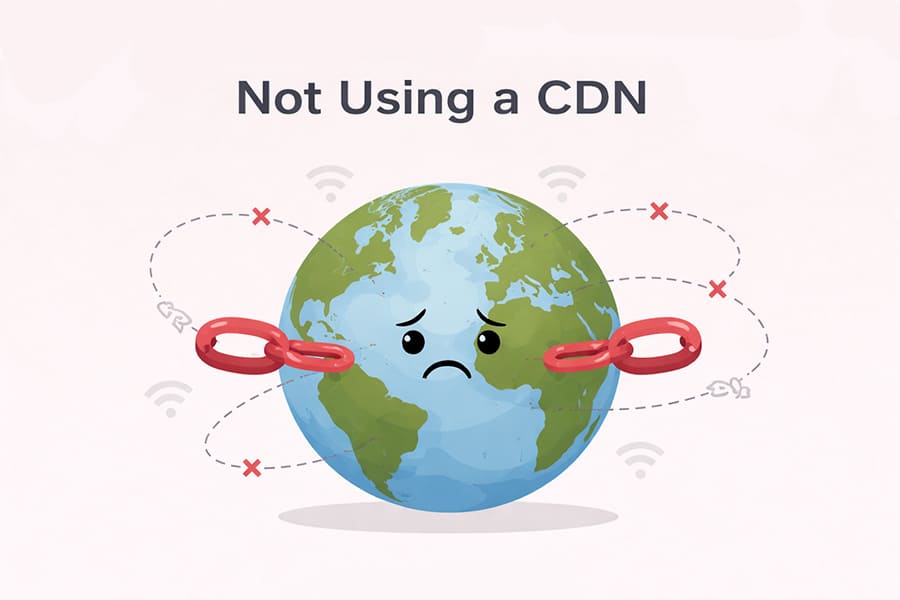
If your website serves users over a wide geographic area (e.g., nationwide or globally), the physical distance between your server and your users can significantly affect load times. A Content Delivery Network (CDN) helps solve this by distributing your site’s static content across a network of servers around the world. Without a CDN, every user’s browser must fetch files from your single host location, which could be thousands of miles away. For example, a user in New York accessing a website hosted in London will experience extra latency as the data travels across the Atlantic and back. If you’re not using a CDN, those long distances can make your website feel much slower for far-flung visitors.
How it affects performance: Distance causes latency – the further data must travel, the longer each request takes. This is especially noticeable for content-heavy pages (lots of images, videos, etc.) because each asset might be coming from the distant server. Without a CDN, your single server also bears the full load of all traffic, which can slow things down during peak usage. Users in regions far from your server may see significantly slower load times or higher ping times compared to local users.
How to identify it:
- Check your audience location analytics (from Google Analytics or similar). If you have a lot of visitors from regions far from your hosting server, they might be experiencing slower speeds.
- Use tools like GTmetrix or WebPageTest, which allow testing from various locations. Run a test from a location on the opposite side of the world from your server – if the load time is dramatically higher than from a nearby test location, lack of a CDN is a likely cause.
- If you see in PageSpeed Insights a suggestion about using a CDN, or notice that initial connections (DNS, TLS, etc.) take long, it hints that distance is an issue.
- Users reporting slowness only in certain countries/regions is a clue. For instance, if U.S. users are fine but Australian users find it slow, geography is at play.
Examples:
- WordPress: A WordPress blog hosted in one region will load slower for visitors in another. Say your WordPress site is hosted in Texas; without a CDN, a reader from India or Europe will have every image, CSS, and JS file coming all the way from Texas, adding maybe hundreds of milliseconds or more to each request.
- Shopify: Shopify actually has a built-in CDN for all stores (Shopify uses Fastly or Cloudflare on the backend for delivering storefront assets). This means Shopify merchants usually don’t need to configure a CDN – it’s handled automatically, and content is served from edge servers globally. However, if you host any assets outside Shopify (like linking to a video or custom library hosted elsewhere), those wouldn’t benefit from Shopify’s CDN.
- Custom codebase: If you host your custom site on a single server (e.g., a data center in one city), global users will get slower response. A SaaS app or e-commerce store with international users should use a CDN for static files. Without it, the farther away a user, the more pronounced the lag.
How to fix it:
- Implement a CDN service: There are many CDN providers (e.g., Cloudflare, Akamai, Amazon CloudFront, Google Cloud CDN, Cloudflare, Fastly, etc.). Many of them are easy to integrate. For WordPress, you can use plugins (like Jetpack Site Accelerator, Cloudflare plugin, WP Rocket’s CDN integration, etc.) to rewrite your static file URLs to go through the CDN. For custom sites, you might configure your domain’s DNS with a CDN or use their API to upload assets.
- Choose a CDN with a broad network: Make sure the CDN has edge servers in the regions where your users are. The more Points of Presence (PoPs) it has, the better. For example, ensure there are servers in North America, Europe, Asia, etc. A good CDN provider with a broad network will ensure users are always downloading files from a nearby server.
- Configure caching and headers: Once on a CDN, set appropriate caching rules. Ensure your static assets (images, CSS, JS, fonts) have long cache lifetimes so the CDN can serve them from cache. Also enable HTTP/2 or HTTP/3 (most CDN providers support these protocols which make multiple file transfers more efficient).
- Enable CDN in Shopify (if applicable): As noted, Shopify uses a CDN by default. Just ensure you are utilizing it by loading your images through the Shopify platform (e.g., using the Shopify CDN URLs for product images). If you have a custom domain, Shopify still serves assets via CDN, so there’s usually nothing extra you need to do.
- Test after implementing: Run location-based tests again to see the improvement. Often, a page that took, say, 4 seconds from Asia might drop to 2 seconds after CDN because the static content comes from a nearby server.
- Bonus – use CDN for whole site (advanced): In some cases, you can cache entire pages on a CDN (full-page caching), which is especially useful for mostly static sites. Services like Cloudflare APO for WordPress can serve even HTML from edge servers, dramatically speeding up global load times. This is more advanced and needs careful cache invalidation logic (so that updates to your site show up), but it’s powerful.
Using a CDN ensures that distance is no longer a barrier for speed. Visitors from around the world will enjoy much faster access to your content, and your origin server will also get some relief from handling every single request.
3. Unoptimized Images and Media Files
Images and videos often make up the bulk of a webpage’s weight. An unoptimized image – for example, a huge photograph straight from a camera – can be multiple megabytes in size. If your site has many images that aren’t compressed or are loaded at full resolution unnecessarily, it will significantly slow down your page. In fact, images are typically the largest content type on most web pages. As of 2023, average websites carry around 800–1000 KB (or more) of images per page on mobile/desktop, which often constitutes the majority of the page’s total size. Large media files take longer to download, especially on mobile or slower internet connections, causing delays in page load or content appearing.
How it affects performance: Big or numerous image files directly increase page load time. Until key images load, users might stare at empty or broken image frames. This can also delay the Largest Contentful Paint (a Core Web Vitals metric) if a large image is the main content. Unoptimized images can also consume excessive bandwidth, potentially making the site unusable for users on limited data plans. Videos or animated media (like GIFs) have a similar effect if not handled properly – a background video can be several MB, dragging down load speed. In short, heavy media = slow website, especially if not mitigated by lazy loading or compression.
How to identify it:
- PageSpeed Insights will explicitly call out image issues. Look for suggestions like “Properly size images” (meaning you’re sending images at larger dimensions than needed) or “Efficiently encode images” (meaning they could be compressed better). It might also mention serving images in next-gen formats (like WebP).
- GTmetrix and Pingdom reports show the size of each element. If you see image files (JPEG/PNG/GIF) that are huge (several hundred KB or multiple MB each), that’s a red flag. GTmetrix also has a tab for “Images” with optimization opportunities.
- Open your site in a browser’s developer tools (Network tab) and sort by file size or load time. Images will likely top the list if they’re unoptimized. You might also notice the dimensions vs. display size mismatch: e.g., an image might be 3000px wide but only displays at 300px on the page.
- Simply observe the page: do images load visibly slowly, popping in one by one? That’s a clue they are too heavy. Also, if mobile loading is especially slow, check if you’re unintentionally delivering desktop-resolution images to mobile devices.
Examples:
- WordPress: Suppose you have a photography blog on WordPress and you upload images at full resolution (e.g., 4000×3000 pixels, 5 MB each). By default, WordPress generates some resized versions, but if your theme is inadvertently using the original image for a slideshow or header, each visitor is forced to download that 5 MB file. Without a plugin to compress or properly scale it, it’s very slow. Even smaller sites: if your logo is a PNG that’s 1 MB because it wasn’t compressed, that’s an easy fix.
- Shopify: Let’s say you run a Shopify store with high-quality product images. If you upload them without compression, a category page might be trying to load dozens of large images. Shopify does create multiple sizes of images and serves a relatively optimized version, but merchants should still upload reasonably sized images. There are also apps that help compress images after upload. If you embed YouTube product videos, loading an entire video player can slow things too (though YouTube is somewhat optimized, it’s still external media).
- Custom site: Perhaps you have a custom-designed website with a big banner video that auto-plays. If that video is not optimized for web streaming (or if it’s high resolution), users will have to download a large file upfront. Similarly, a custom site might not have the kind of built-in image handling WordPress/Shopify do, so if the developer didn’t implement image resizing, you might be sending raw images. We’ve seen cases where a company’s team uploaded images directly to the site’s
/imagesfolder without optimization – leading to a painfully slow site.
How to fix it:
- Compress and optimize images: Before uploading images, compress them either manually or using tools. Services like TinyPNG or TinyJPG (online tools) can reduce file size significantly without visible quality loss. There are also offline tools (like Photoshop’s “Save for Web”, or free tools like Squoosh). For WordPress, use plugins such as Smush, ShortPixel, or Imagify – these plugins automatically compress images on upload and can even bulk-compress existing ones. They also often can convert images to next-gen formats.
- Resize images to proper dimensions: Do not upload a 4000px wide image if it will display at 400px. Resize it to the max size needed. You can do this in an image editor before uploading. WordPress helps by creating multiple sizes (thumbnail, medium, large), so use those appropriately in your theme (e.g., use the
<img srcset>attribute or appropriate functions to serve smaller versions on mobile). Shopify merchants should upload reasonably sized images (Shopify usually limits image max pixel size, but ensure you’re close to what you need, not far above). - Use next-gen formats (WebP/AVIF): Formats like WebP offer the same quality at much smaller file sizes than JPEG/PNG. WebP is widely supported in modern browsers. WordPress 5.8+ supports WebP upload out of the box. There are plugins that will create and serve WebP images to browsers that support them (while falling back to JPEG for those that don’t). Shopify also now supports WebP for images on storefront. Converting large PNGs (for photos) to JPEG or WebP can also help, since PNG is best for graphics/logos, not photographs.
- Enable lazy loading: Lazy loading means images (or iframes/videos) that are not immediately visible (below the fold) won’t load until the user scrolls to them. This greatly reduces initial load time and bandwidth. WordPress has native lazy loading (
loading="lazy"attribute on images) enabled by default on images further down the page. Ensure your theme hasn’t disabled it. If it’s a long one-page site, plugins like Lazy Load by WP Rocket or a JavaScript library can further tune this. In Shopify, most modern themes include lazy loading for product images; verify by checking the site’s HTML forloading="lazy". If not present, consider theme updates or apps that add lazy loading. For videos, consider using a placeholder image and loading the video player only when clicked (there are plugins and scripts for “lazy load YouTube video”). - Optimize other media: For videos, using an external host (YouTube, Vimeo) is usually better than self-hosting a heavy video file. You can also load videos in lower resolution on mobile. For other media like PDF downloads, host them externally or ensure they’re not loading on page start.
- Use image optimization apps or services: On Shopify, apps like TinyIMG, SEO Image Optimizer, or Crush.pics can compress images in your store automatically and even add SEO alt tags. On WordPress, we mentioned image optimization plugins – many have free tiers for a number of images per month.
- CDN for images: Ensure your images are delivered via a CDN (see point #2). Services like Cloudflare can also perform “Polish” (image compression and WebP conversion) on the fly if you enable those options.
- Remove or replace heavy assets: If an image is purely decorative and huge, consider if it’s needed. Maybe a simpler design could remove that background image or replace a heavy animated GIF with a static image.
After these optimizations, your pages will shrink dramatically in size. For example, converting a 1MB JPEG to WebP might make it 300KB with no visible loss. Compressing 10 images could save seconds off load time. Your users will notice the site loads much quicker, and your performance scores will improve as media-related audits go green.
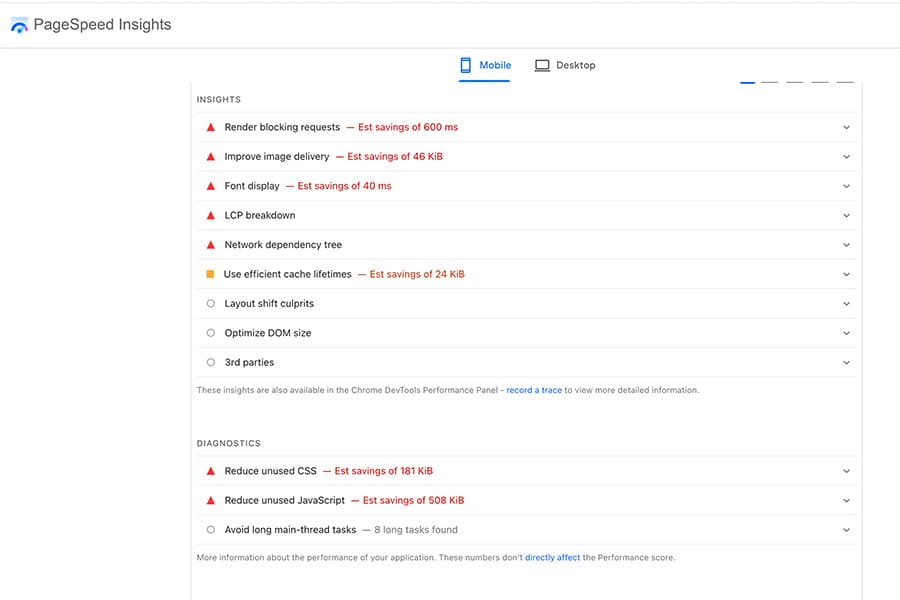
Screenshot: PageSpeed Insights “Opportunities” showing “Properly size images” with specific images that need reduction (placeholder)
4. Excessive or Unoptimized CSS and JavaScript (Render-Blocking Resources)
Your website’s CSS (stylesheets) and JavaScript are what make it look good and interactive, but if they are not optimized, they can severely slow down your site. Common issues include too many separate CSS/JS files, files that are larger than necessary, and render-blocking behavior (especially CSS or synchronous JavaScript loading). Each CSS or JS file is a resource that the browser must request; having a multitude of them increases the number of HTTP requests, and until the browser obtains and processes them, it might not fully display the page. Additionally, if these files are not minified (i.e., contain unnecessary whitespace, comments, or unused code), their file sizes are bigger than needed, adding download time. Unoptimized JavaScript – such as heavy scripts or not deferring non-critical JS – can also block the page from becoming interactive. Similarly, unoptimized CSS (or lots of CSS files) can delay the rendering of page content.
How it affects performance:
- Render-blocking CSS: Browsers typically must load all CSS files that are in the page’s
<head>before they can fully render the page. If you have large CSS files or many CSS files, the browser spends time fetching all of them while the user stares at a blank or partially styled page. - Render-blocking JS: If JavaScript files are loaded without
asyncordefer(and not placed at the bottom), the browser can pause HTML parsing to execute JS, which delays page rendering. Heavy scripts (like big libraries or lots of inline script) can also tie up the browser’s main thread. - Too many HTTP requests: Although modern HTTP/2 allows parallel loading of files, having, say, 50 separate files still incurs overhead (each has some latency and header exchange). It also means less efficient caching – vs. one combined file, you have 50 files that each have to be requested and later revalidated.
- Unminified code: If your CSS/JS files are not minified, they might be double or triple the size just due to spaces, comments, and formatting. That’s wasted bandwidth and time. Also, unused CSS (common when using big frameworks or themes) adds bloat – you’re loading rules that don’t even apply on that page.
- Frameworks and libraries: Using large frameworks (like loading the entire Bootstrap CSS when you only use a fraction of it, or loading jQuery plus several jQuery plugin scripts) can balloon your page size and load time.
- Cumulative effect: All these factors combined can lead to a slow Time to First Paint and Time to Interactive – users see a slow-loading or unresponsive page initially.
How to identify it:
- PageSpeed Insights will highlight render-blocking resources. If you see “Eliminate render-blocking resources” in the report, it will list which CSS/JS files are holding up rendering. It might also flag “Remove unused CSS” if applicable.
- Tools like GTmetrix have a waterfall chart – check how many CSS/JS files are being loaded and at what point. If the waterfall shows a long list of
.cssand.jsfiles loading early, you likely have many requests. The GTmetrix “Structure” tab also often flags unminified files or too many files. - Use the Coverage tab in Chrome DevTools (Performance > Coverage) to see how much of your CSS/JS is actually used by the page. You might be surprised to find, for example, only 30% of a 200KB CSS file is used by the current page.
- Simply inspect your site’s HTML source: see how many
<link rel="stylesheet">and<script>tags are present, especially in the head. A long list hints at potential to combine or defer some of them. - If you’re on WordPress, plugins like Query Monitor or Asset CleanUp can list all the CSS/JS loaded on a page. You may find plugins injecting files site-wide even if only needed on one page.
- Check if your files are minified: A minified file will look like one long line of code (no spaces or line breaks). If you open a CSS/JS file and it’s nicely formatted and human-readable, it’s not minified – room for improvement.
Examples:
- WordPress: You might have a theme and 10 plugins active. Each plugin might add its own CSS/JS file. For instance, a slider plugin adds
slider.cssandslider.js; a contact form plugin addsforms.cssand scripts; your theme itself loads multiple CSS files (maybe one for fonts, one for layout, one for custom styles) and uses jQuery plus some theme scripts. It’s easy to end up with 20+ CSS/JS files. If none are concatenated or minified, that’s a lot of overhead. Also, maybe your theme isn’t using critical CSS, so it loads a giant CSS file upfront even though only the top part of the page is needed initially. - Shopify: Shopify themes often are optimized, but if you installed many apps, some apps inject scripts into your theme. For example, an analytics app, a review widget, a chat widget – each could insert a separate JS file (from a remote server) and perhaps some CSS. A theme might also load multiple scripts for features you might not be using (like a carousel script on pages with no carousel). By default, Shopify serves assets minified, but there could still be a lot of them. Also, older themes might not use modern techniques like
defer. - Custom codebase: If the site was custom-built without using a build process, the developers might have included many separate library files (e.g.,
jquery.js,bootstrap.js,bootstrap.css, etc.) individually. If they didn’t minify or bundle them, that custom site might be loading a dozen files where 2-3 bundled files could do. We’ve seen custom projects where every page included separate script tags for features, resulting in redundant loads on each page.
How to fix it:
- Minify CSS and JS: Use tools or plugins to minify your code. Minification removes whitespace, comments, and shorten variable names (for JS) – reducing file size. For WordPress, plugins like WP Rocket or Autoptimize can automatically minify your CSS/JS files. In Shopify, most themes are already minified; if not, you can run the theme assets through an online minifier or use a build pipeline if you’re editing the theme. For custom setups, incorporate a build step (using tools like webpack, Gulp, or even online minifiers for quick fixes).
- Combine files (reduce HTTP requests): Especially for older HTTP/1.1 servers combining was crucial; with HTTP/2, parallel downloads are better, but combining can still help overhead and is often recommended by optimization plugins. If you have 5 CSS files, combine them into 1 or 2 if possible. Same for JavaScript. In WordPress, Autoptimize or WP Rocket can combine CSS/JS into single files (beware of possible plugin conflicts – test thoroughly). In custom builds, use webpack/rollup to bundle modules into one file. On Shopify, you might manually merge CSS files in the theme if you know how (or use a tool like ThemeKit to build assets).
- Defer or Async JavaScript: Identify which scripts are not needed immediately and load them asynchronously. For example, analytics or chat widgets can often be loaded with
asyncso they don’t block the page. For critical JS that must run, usedeferso it executes after HTML parsing. In WordPress, WP Rocket has an “load JS deferred” option and plugins like Async JavaScript can help. For custom, ensure your<script>tags havedefer(if placed in head) or place them just before</body>to naturally defer until after content. Shopify app scripts often are loaded asynchronously by nature (since they’re external), but double-check. - Inline critical CSS: One advanced technique is to inline the CSS needed for the above-the-fold content directly in the page’s
<head>(this is “Critical CSS”). This way, the browser can render the initial view immediately, without waiting for the full CSS file. The remaining CSS can be loaded asynchronously. Tools like WP Rocket can generate critical CSS for each page automatically. There are also online tools to extract critical CSS. If implementing manually, you’d need developer help to do this in a custom site or theme. - Remove unused CSS/JS: Audit your files for code that isn’t used. For instance, if you included an entire library but only use one function from it, see if you can load a smaller part or remove it. If a WordPress plugin is adding CSS for a feature you don’t use, disable that output (some plugins let you, or you might deregister the style in functions.php). There are plugins like Asset CleanUp or Perfmatters (WordPress) that let you disable certain CSS/JS on pages where they’re not needed (e.g., you can prevent the contact form plugin from loading on pages that don’t have a form).
- Use modern frameworks wisely: If using something like Bootstrap, consider customizing the build to include only needed components (Bootstrap’s Sass can be configured to exclude unused components, reducing file size). Similarly, for icon libraries, only use needed icons or icon fonts.
- Leverage tree-shaking (for JS builds): If you have a custom JS build, use a bundler that removes unused code (tree-shaking). This requires using ES6 modules and such, but can significantly cut down bundle size by dropping code you didn’t import.
- Test after changes: After minifying/combining, always test your site’s functionality thoroughly. Sometimes combining JS from multiple plugins can cause issues if not done carefully. Use your performance tools again to see the difference – ideally fewer requests and smaller total download size.
By optimizing your CSS and JS, you’ll likely see improvements in metrics like First Contentful Paint (FCP) and Time to Interactive. The page will start displaying faster and become usable quicker, which greatly improves the user experience.
5. Lack of Caching (Browser Cache and Server Cache)
Caching is a technique to serve content faster by storing reused data closer to the user or reducing regeneration. If your site is not leveraging caching, it will be inherently slower, especially on repeat visits or under load. There are two main types to consider: browser caching (telling browsers to store certain files so they don’t re-download them every time) and server-side caching (where your web server stores pre-built pages or database query results to serve future requests faster). When caching is absent or misconfigured, the browser must fetch everything anew on each visit, and the server must work from scratch to generate pages for every user every time. This is like forcing a store to build a new product for each purchase rather than having an inventory – extremely inefficient.
How it affects performance:
- Without browser cache, returning visitors (or users navigating multiple pages) will have to reload the same resources (images, CSS, JS) repeatedly. This increases load times and bandwidth usage. Proper caching would make those files load from the local disk cache almost instantly on subsequent page views.
- Without page caching on the server (for dynamic sites like WordPress), each page view triggers all the backend processing: database queries, PHP code execution, etc. This adds significant time (maybe hundreds of milliseconds or more per page) that could be saved if a cached HTML version was served. For high traffic, it also puts strain on the server, potentially slowing down everyone as it struggles to build pages for each visitor simultaneously.
- If your caching is set up but not working (e.g., a misconfigured plugin or a conflict causing pages not to actually cache), you might unknowingly be running without this speed benefit.
- No caching also means high variability in performance – your site might be fast when one user is on (with low load) but crawl when many users hit it (since the server isn’t handling the reuse of content efficiently).
How to identify it:
- First-time vs repeat load: Load one of your pages in an incognito window (no cache) and note the time. Then load it again (or remove incognito to allow cache) and see if it’s faster. If the second load is significantly faster, browser caching might be working. If it’s the same, you likely have no effective browser caching for static assets.
- Run PageSpeed Insights; look for “Serve static assets with an efficient cache policy” or similar message. If it flags that certain resources don’t have caching headers (or short cache times), then browser caching isn’t optimized.
- On the server side, for WordPress, an easy way: if you have a caching plugin, check if it’s actually caching (many plugins add a comment in the HTML source like “<!– Cached by WP Super Cache –>”). If you find no evidence of caching and page generation times are high, you might not have it.
- Use webpagetest.org and check the repeat view (it loads the page twice to simulate a repeat visitor). If the repeat view is nearly as slow as the first, that indicates little is cached on the browser side.
- If you have server access, measure how long it takes your server to generate pages (enable query logging or use a plugin like Query Monitor). If every page load triggers dozens of database queries and heavy processing, you probably have no caching layer.
- On Shopify, while you can’t control server caching, Shopify does cache certain content automatically and uses CDN for assets. It’s usually not a concern on Shopify – but you can still check browser caching headers using dev tools (Shopify by default sets good cache headers for assets like images, CSS, etc. The HTML itself is dynamic but their servers handle that quickly).
Examples:
- WordPress: Without any caching plugin, each time someone hits your page, WordPress will run all the PHP code, talk to the database for posts, settings, menus, etc., and build the HTML. This might take, say, 0.5 seconds per page (or more if your database is slow). Multiply that by 100 users browsing simultaneously and the server load spikes, making it slower for everyone. With a caching plugin, that page would be saved as a static HTML file after the first load, and subsequent visitors (or even the first visitor’s subsequent clicks) get the ready-made HTML in maybe 0.05s instead of 0.5s.
- Shopify: As mentioned, Shopify handles caching on their end. However, as a store owner you should ensure you’re not doing things that circumvent it – for example, an app that adds a unique query parameter to assets might bust caches. Generally, you don’t need to worry here, but just for completeness: Shopify’s CDN means images, JS, CSS are cached on the edge. The main HTML of pages is dynamically generated but optimized. So Shopify merchants largely get caching benefits by default.
- Custom site: If built on a framework (like Node, Django, etc.) without caching, similar issues arise. Every page might involve expensive operations. For instance, a custom product catalog might query the database for every category page load. If you implement caching (even simple file-based caching or in-memory caching for queries), you could serve pages much faster. Without it, the site might buckle under moderate traffic. We’ve seen custom apps where enabling something like Redis caching of frequent queries reduced response times from multiple seconds to under one second.
How to fix it:
- Use a caching plugin or solution (WordPress): For WordPress sites, this is a must. Plugins like WP Rocket, W3 Total Cache, WP Super Cache, or Autoptimize (which has some caching capabilities) will generate static HTML copies of your pages and serve those to users. WP Rocket is a popular premium choice that handles page caching, browser caching headers, and more automatically. Even a free plugin like WP Super Cache can do basic page caching effectively. Once installed and configured, test your pages – the second load should be much faster and server CPU usage should drop.
- Enable browser caching (headers): Ensure your web server is instructing browsers to cache static files. This usually means setting
Cache-ControlorExpiresheaders for assets. Many caching plugins or CDN services handle this. For example, you might set images to cache for 30 days, CSS/JS for a week (or even longer if you use versioned file names). That way, when a user navigates to a second page on your site, their browser can reuse the files it got from the first page without re-downloading. In Apache or NGINX, this can be set via config; on Shopify, it’s built-in (their assets have long cache lives). You can verify by looking at response headers in DevTools (should seeCache-Control: max-age=...). - Implement server-side caching (custom sites): For custom code, you might need to implement caching at the application level. This could mean using an object cache (store results of expensive database queries in memory so subsequent requests fetch from memory) or full page caching. Many web frameworks have caching libraries. For example, a Django site can use the Django cache middleware to cache pages. Node.js sites can use in-memory caches or external services. The concept is to avoid redoing work for each request.
- Use a CDN or reverse proxy cache: As an alternative or addition to plugin-based caching, you can use a service like Cloudflare not just for CDN but also for caching your pages (if your site is mostly static content). Cloudflare’s page rules or APO (Automatic Platform Optimization for WordPress) will cache even the HTML of your pages on their edge servers, meaning many users get the page without hitting your server at all. This can make your site insanely fast globally – essentially serving it almost like a static site. Just ensure to set it to bypass cache for pages that shouldn’t be cached (like cart or checkout pages, or when a user is logged in).
- Database caching: Consider caching database query results either via your application or a plugin. For WordPress, if you have an object cache (Redis/Memcached) available, use it – plugins like W3 Total Cache or WP Rocket can integrate with it. This won’t directly speed up first page load for a user, but it speeds up the generation of pages by reusing query results.
- Verify caching is working: After setting up, do the tests again. Look at the response headers of your pages – do you see indications of cache hits? (For example, WP Super Cache will have a header or HTML comment). Use a speed test to see the difference in repeat load. Ideally, a second view should load much quicker, and in WordPress, logged-out users should all be getting cached pages.
- Edge cases: Be careful to configure caching properly for content that updates frequently or personalized content. E.g., don’t cache a page that shows a user’s name after login (unless you vary cache by user which gets complicated). Most page caching is for public pages (blog posts, product pages). Comment forms or shopping carts usually bypass cache to function correctly. Caching plugins often handle these nuances out of the box (for example, by not caching URLs with
?add-to-cartor user-specific cookies). - Purge cache on updates: Remember that if you update your site (new post or design change), you may need to clear the cache so the changes show up. Good caching tools do this automatically (e.g., when you publish a new post, the cache for that page and maybe homepage is purged).
In summary, caching can yield huge performance improvements with relatively little downside when configured correctly. It’s one of the first things to ensure for a faster site – effectively turning dynamic pages into speedy static ones for the user. With caching in place, your server does a lot less work and your users see pages load in a snap on return visits.
6. Too Many Plugins or Apps (Bloat in Platform Extensions)
Modern website platforms allow adding functionality through plugins (WordPress) or apps (Shopify). While these are incredibly useful, each one you add can also add overhead. If your site relies on a large number of plugins/apps, it may be suffering from plugin bloat – where the sheer number of extensions (or a few particularly heavy ones) slow everything down. Every plugin might introduce its own scripts, styles, database queries, or background processes. On WordPress, for example, a plugin could increase page load by querying the database or performing an external API call. On Shopify, an app might inject additional JavaScript or run code on every page. All of this accumulates. Having too many or poorly optimized plugins can therefore result in slower page loads and even server strain.
How it affects performance:
- Front-end impact: Many plugins/apps add visual elements or tracking, which means extra JS/CSS files loaded (as discussed in point 4) and perhaps images or fonts. For instance, an Instagram feed plugin might load an extra CSS file and hit the Instagram API. Multiply that by 10 plugins doing similar things, and your page gets a lot heavier and slower to render.
- Back-end impact: In WordPress, plugins can hook into page generation. A membership plugin might check user permissions, a SEO plugin might modify queries, etc. The more plugins, the more PHP code runs on each page load, increasing processing time. Some plugins run expensive database queries or don’t scale well with lots of data.
- Database bloat: Plugins often add tables or store data. Over time, you might accumulate orphaned data (like if you removed a plugin, but its data remains). This can slow down the database slightly (though typically minor unless it’s huge amounts of data being autoloaded every page).
- Conflicts and inefficiencies: Two plugins might do overlapping things or conflict, causing performance issues (like two analytics plugins both trying to do something with each page, doubling the work).
- Shopify apps code: Each app might add a snippet to your theme. Even after uninstalling an app, sometimes that code stays behind (if not cleaned up), meaning you have unused code running.
- Memory usage: More plugins means higher memory usage on the server, which can lead to slowdowns if the server is constrained.
How to identify it:
- Count your plugins/apps: Simply list how many you have active. 5-10 well-chosen ones are usually fine on WordPress; 40 active plugins is often a red flag (though not always – it depends what they do). Similarly, if your Shopify store has a dozen apps, especially those that affect storefront, it’s likely impacting speed.
- Use performance profiling tools: On WordPress, you can use plugins like Query Monitor or New Relic APM (if available) to see which plugins are using the most time or database queries on a page load. There’s also a plugin called “P3 (Plugin Performance Profiler)” – old but sometimes still works – which gives a breakdown of plugin impact. Newer alternatives like Query Monitor are more manual but effective.
- Disable plugins one by one: If feasible, clone your site to a staging environment and try deactivating plugins to see if performance improves significantly. You might find one plugin that when off, everything speeds up (pointing to it as a problem).
- Check for redundant functionality: Maybe you have multiple plugins where one could do the job. Or a plugin that you installed for a one-time task but left active.
- For Shopify, in the admin go to Online Store > Speed report. Shopify provides a speed score and even identifies which apps are affecting your speed. It might say e.g., “XYZ app is adding 200KB of code” etc. This is super useful to pinpoint offending apps.
- Look at your page’s source code or network requests for names of scripts – often they include the plugin or app name. E.g.,
facebookchat.jsoryotpo.js(a reviews app) etc. That reveals what’s loading. - Check browser dev tools Performance profile – sometimes you’ll see function names that hint at a plugin (for advanced analysis).
Examples:
- WordPress: Imagine a small business site that installed plugins for every little need: a plugin for contact forms, one for sliders, one for SEO, one for Google Analytics, one for site stats, one for social sharing, one for backups, etc. Some themes also bundle tons of functionality (like page builders) which are essentially giant plugins. If you have 20-30 plugins, it could be fine if they are lightweight, but often there will be a few that significantly slow things. For instance, a popular but heavy plugin might be one that builds pages with a lot of dynamic content, or an e-commerce suite like WooCommerce adds load. If you also added something like a related posts plugin that runs complex queries, the site can get slow.
- Shopify: Common apps include product review widgets, live chat, pop-up banners, analytics, upsell apps. Each might add a snippet. One app might not be an issue, but 5-6 together can noticeably drag. For example, a reviews app might load a bunch of JS to display reviews, a chat widget constantly pings servers, a personalization app might run its script… The result could be a slower Time to Interactive because so many scripts are executing.
- Custom code: Instead of plugins, you might have lots of third-party libraries or custom modules enabled. If the site is on a CMS like Drupal or Joomla, too many extensions can similarly slow it down. The principle is the same – bloat from excessive add-ons.
How to fix it:
- Audit your plugins/apps: Make a list of all extensions and assess necessity. Remove or disable anything you don’t truly need. Sometimes a plugin was added for testing and forgotten – get rid of those. If an app isn’t providing enough value to justify the speed hit, consider removing it.
- Find lighter alternatives: If you do need the functionality, see if there’s a more performance-friendly way. For example, maybe the fancy slider plugin can be replaced with a simpler built-in slider that came with your theme. Or a heavy social feed plugin could be replaced with a simple embedded widget. In WordPress, some plugins are known for being heavy (with lots of features) – you might replace them with a more focused plugin that does just what you need. Similarly, some Shopify apps might be overkill if you could implement a simpler solution (like adding a bit of code in the theme instead of a whole app).
- Combine functionality: Sometimes one plugin can replace several. For instance, Jetpack for WordPress can handle a variety of features (site stats, related posts, lazy images, etc.) so you don’t need separate plugins for each (though Jetpack itself has a footprint, you’d evaluate trade-offs). On Shopify, some apps offer suite features (SEO optimization apps that handle image compression, alt tags, etc., in one).
- Keep plugins updated: Ensure all extensions are up to date. Developers often improve performance in updates. Also, outdated plugins can conflict or cause errors that slow things down (not to mention security issues).
- Limit plugins that load site-wide: It’s not just quantity, but which ones run on every page. For example, a contact form plugin might only load on the contact page (that’s fine). But an SEO plugin runs on the backend, not affecting front-end speed (except generation time maybe). However, a poorly coded plugin might be doing things on every page. Identify those and see if you can limit their scope. Some WordPress plugins let you configure “only load on these pages”.
- Use code snippets instead of plugins for simple tasks: If you’re comfortable or have a developer, sometimes adding a few lines of code in your theme can achieve something small that you installed a whole plugin for. The plugin’s overhead (settings, UI, etc.) isn’t worth it for a tiny feature. This requires technical skill but can trim bloat.
- For Shopify: After removing apps, be sure to remove any leftover code. Uninstalling an app usually stops its backend process, but any code it added to your theme might stick around. Check your theme.liquid and other layout files for remnants of uninstalled apps (often marked with comments). Remove those or revert to a backup theme file if you have one from before the app.
- Test as you remove each item: Don’t remove 5 plugins at once and then find something broke. Go one by one, and quickly check your site (functionality and speed). This way you know what change made a difference or caused an issue.
- Vetting new plugins/apps: Going forward, choose quality over quantity. Research a plugin’s impact (some blogs test and compare, or you can test on a staging site). Read reviews regarding speed. For Shopify apps, consider their scope – some apps mention if they’re “lightweight” or if they use best practices. Always remove trial apps that you decided not to use.
By trimming down to just the necessary, well-built extensions, your site can run much faster. Many sites have seen dramatic speed gains just by deactivating a few problematic plugins (e.g., cutting load time in half). It’s a balance: functionality vs performance. Aim for lean functionality – everything you keep should earn its place by providing value that outweighs any speed cost.
7. Too Many External Scripts or Ads (Third-Party Bloat)
Even if your own site’s code is optimized, including a lot of third-party scripts can slow you down. These are things like ad network scripts, analytics trackers, social media widgets, embedded videos, or external font libraries. Each third-party script means your visitor’s browser has to connect to another server (or several) and download resources, which might not be as optimized or quick as your own server. Ads are a prime example: they often load rich media and multiple redirects between ad servers, significantly adding to page load time. Essentially, every external widget or script is something not entirely under your control, and if you have too many, they can collectively drag your performance down.
How it affects performance:
- Additional HTTP requests: Each external resource (like a script from googletagmanager.com or a Facebook “Like” button iframe) is another request the browser must make. These might also block rendering (for instance, an analytics script might be small but if it’s in the head without async, it can delay other loads).
- Latency and server speed: External servers might be slower to respond than yours. If one of them is slow to deliver, your users wait. For example, if your page is trying to load a Twitter feed widget and Twitter’s API is slow at that moment, your page might hang on that.
- Payload size: Some third-party scripts bring in large payloads. An ad might load a megabyte of video or a high-res image. A heatmap analytics script might download a big chunk of JS to record user interactions.
- CPU overhead: Third-party scripts, once loaded, also execute on the user’s browser, potentially consuming CPU (e.g., interactive widgets or heavy ad animations). This can particularly hurt mobile devices.
- Security and stability: Not directly performance, but if a third-party script has an issue (or the domain goes down), it can break parts of your site or cause long load delays (as the browser may wait for it to timeout).
- Cumulative effect: A few small external scripts are usually fine, but a page littered with them (common on sites with multiple ad units, several tracking pixels, etc.) will have a much longer waterfall. Each also might open new TCP connections (unless HTTP/2 multiplexing if on same domain), and do DNS lookups for new domains – each step adding milliseconds.
How to identify it:
- Look at your site’s network waterfall (in Chrome DevTools or GTmetrix). Requests that are not from your domain or your CDN are third-party. You might see Google Analytics (
www.google-analytics.com), Facebook (connect.facebook.net), advertising domains, etc. If you see many different hostnames, note which they are and what they might be related to. - PageSpeed Insights has a section for “Third-Party Resources” that highlights the impact of third-party scripts on load. It might show how many milliseconds each third-party domain is contributing. If you have a lot (or one is particularly slow), it’ll be evident there.
- If using a content blocker (like a browser extension) and you notice the site is faster when it blocks, that indicates those were heavy third-party elements.
- Check your site’s HTML for any embed codes or script tags from external sources. Sometimes they’re directly in the code (like a script snippet for a chat widget). If you have a tag manager (like Google Tag Manager), remember it can load multiple external tags within it (so one snippet could actually bring in several others).
- On Shopify, apps that integrate third-party services (like a reviews widget pulling in from an external service) count here too.
- For ads: Tools like Google’s Publisher Ads Audits for Lighthouse can specifically analyze ad-related load if you’re running a lot of ads.
Examples:
- Ad-heavy site: A news website might have multiple ad slots. Each slot could call an ad exchange, which then loads an ad (possibly from another domain). The page might also include a bunch of trackers for those ads (viewability trackers, etc.). It’s not uncommon for such pages to have dozens of third-party requests and seconds of time spent just loading ads. While a small business site might not have that many ads, even one or two slow ad scripts can hurt.
- Multiple analytics/trackers: Suppose you put Google Analytics, Facebook Pixel, maybe Hotjar (for heatmaps), and an A/B testing script. That’s four different external scripts. They might not be huge, but together they add delay. Hotjar in particular loads a decent amount of JS to record user sessions.
- Social media widgets: If you have embedded YouTube videos, an Instagram feed, Twitter timeline, etc., each of those is pulling content from those platforms. An embedded YouTube video loads the YouTube player script (~500KB of script) plus starts fetching video thumbnail or video stream. Instagram embeds load their widget JS and fetch images. These can slow down initial load.
- Fonts and icon libraries: Linking to Google Fonts or Font Awesome’s CDN is common. These are external but usually fairly optimized networks. Still, a Google Fonts call might add a few hundred milliseconds, and if not done properly, can block text rendering (the infamous FOIT – Flash of Invisible Text – if fonts aren’t loaded quickly). Loading 5 different font families externally can exacerbate the issue.
- Shopify apps (third-party mode): Some apps on Shopify actually operate by inserting an external script (from the app developer’s server) into your site. For instance, a reviews app might serve the reviews via their own servers using a script include. If that app’s server is slow or far, it affects your page.
How to fix it:
- Limit the number of third-party scripts: Do an honest evaluation of what external integrations are truly providing value. If you have multiple analytics, can you consolidate? (Maybe use Google Tag Manager to manage and possibly delay some until needed). If you have multiple advertising networks, consider reducing or using a unified platform. Each removed script can shave off some time.
- Load scripts asynchronously/deferred: For those you keep, ensure they are loaded in a non-blocking way. Most analytics and ad scripts provide async snippets. For example, Google Analytics has an async script include. Make sure you use that so it doesn’t hold up other rendering. For embeds like YouTube, you can defer loading by using a placeholder image and loading the video player script only when the user clicks “Play” (there are plugins and tutorials for “lazy loading YouTube videos”).
- Use performance-focused alternatives: Some third-party functionalities can be done in a more lightweight way. E.g., instead of a live Instagram feed widget (which hits Instagram’s API), you could manually curate a few recent images and embed them directly. Instead of a heavy chat widget that loads on every page, maybe use a lighter one or show it only on certain pages or after a delay.
- Optimize ad loading: If you run ads, use lazy loading for ads below the fold (Google AdSense now has an option for this). Limit the number of ad slots per page if possible. Ensure you’re using updated ad code (older ad scripts might be synchronous; newer are async). If you have the ability, set timeouts so if an ad network is slow, it doesn’t block everything.
- Host assets locally if viable: For something like fonts or small scripts, you can sometimes host them on your server to eliminate an external request. E.g., download Google Fonts files and serve them yourself (though then you lose the benefit of Google’s CDN). This is a trade-off and depends on caching and usage (browsers often cache Google Fonts across sites, so a user might not need to re-download if they visited any site using the same font).
- Use a CDN for third-party if possible: Some third-party scripts allow choosing a CDN or hosting copy. E.g., you can load some popular libraries from a CDN (like jQuery from Google CDN or jsDelivr). But those are still third-party from your site’s perspective (just well-distributed ones). This mainly helps if lots of sites use the same CDN resource (cache hits).
- Delay loading non-critical third-party content: Another tactic is to let your main content load first, and load third-party stuff after a short delay or after user interaction. For example, some sites load chat widgets only after, say, 5 seconds or only when the user scrolls to a certain point. This ensures the initial experience isn’t hampered. If you use Google Tag Manager, you can configure some tags to fire on a delay (or only on certain pages).
- Monitor third-party performance: There are tools/services that specifically monitor third-party impact (like SpeedCurve’s third-party monitoring). While you might not use those directly, keeping an eye via your regular tests will tell you if, say, one of the third parties suddenly got slower, and you might then reconsider it.
- In Shopify: When installing a new app, check if it mentions performance. Some apps pride themselves on “no impact on speed” by loading after onload event or similar. If an app is crucial but heavy, ask the developer if they have options to optimize (maybe turn off parts of it you don’t use).
- Remove any dead third-party links: Sometimes you might have an old script tag still in your code that isn’t needed (e.g., you tried a service and removed it but the code remains). Clean those out to avoid any unnecessary requests.
By reducing and carefully managing third-party content, you’ll notice faster loads and a smoother experience. Users often don’t directly see what’s causing a slow site – they just feel it’s slow. But behind the scenes, trimming a few external widgets can dramatically reduce load time. For instance, one less tracker could mean one less second in worst cases. It’s all about weighing the benefit of that third-party feature vs the speed cost.
8. Bloated Theme or Inefficient Code (Heavy Themes, Page Builders, and Outdated Software)
Sometimes the very design or code structure of your site can be a source of slowness. Bloated themes (especially on platforms like WordPress or Shopify) that include lots of unnecessary features, or heavy use of page builder tools, can introduce a lot of extra code. Similarly, if you’re running on an outdated platform or codebase, you might be missing performance improvements that newer versions offer. Inefficient code – whether it’s in your theme, plugins, or custom scripts – can cause slowdowns by doing more work than necessary. Examples include themes that load 10 different font files when only 2 are used, or custom code that isn’t optimized (like pulling an entire dataset when only a few items are needed). Over time, if you haven’t maintained your site’s software (CMS version, PHP version, etc.), that can also contribute to slowness.
How it affects performance:
- Bulky themes: Many off-the-shelf themes come with a ton of features to cater to various user needs (multiple sliders, fancy animations, builders, etc.). This often means lots of files and larger file sizes. Even if you don’t use all features, they might still be loaded. For example, a theme might have an option for a video background and thus load a big video script library site-wide, even if you didn’t enable a video background.
- Page builders (WP): Builders like Elementor, Divi, WPBakery, etc., make site design easy but can produce hefty HTML and include many CSS/JS files. The output can be an order of magnitude more code than a hand-optimized page. This extra weight affects network load and browser rendering.
- Inefficient server-side code: Perhaps your site’s code isn’t doing things in the fastest way. For WordPress, maybe a poorly-coded function in the theme queries the database in a slow way. For a custom site, maybe there are no indexes on the database queries (so it takes longer to fetch data). These inefficiencies might not be obvious to an end user until the site grows (more content or traffic makes them more pronounced).
- Not updated CMS or software: Running an older version of WordPress, or an old PHP version, can slow things down. Newer versions often have optimizations. For instance, WordPress 6.x introduced better performance in various areas; PHP 8 is significantly faster than PHP 7. If you’re on outdated versions, you’re not benefiting from these improvements. Outdated software can also have compatibility issues that inadvertently cause slow errors or warnings (which can fill logs or slow execution).
- Excessive DOM size: A bloated theme might output an extremely large HTML DOM (like nested elements, long lists without virtualization, etc.). A huge DOM (say, thousands of elements) can slow down browser rendering and JavaScript execution (any DOM manipulation becomes costly).
- Heavy use of webfonts/icons: Some themes load many icon font libraries or dozens of webfont variants. Each of these is an asset and also heavy on rendering (fonts need to load then text re-renders).
- Outdated techniques: Perhaps the theme still uses old scripts or libraries (like an old jQuery version with known performance issues, or doesn’t use newer CSS that could reduce needing JS, etc.).
How to identify it:
- Evaluate your theme/template: Is it known for being “lightweight” or is it marketed with tons of features (often meaning heavy)? If using WordPress, test switching to a default lightweight theme (like Twenty Twenty-Three or GeneratePress) temporarily to see if the site speeds up dramatically (on a staging site!). If yes, your theme was a bottleneck.
- Use testing tools: Lighthouse (in Chrome DevTools) will flag issues like an excessive DOM size or too many font loads. It might also indicate if a lot of unused CSS is present (common in bloated themes).
- Look at your page source and size: If a basic page on your site is, say, 5MB of HTML/CSS/JS total, that’s huge. Possibly a sign of bloated theme or builder output. Many simple pages should be under 1MB excluding images.
- Profile the site: For WordPress, Query Monitor plugin can show slow database queries and what theme/plugin triggered them. You might find that a certain template part of your theme is making an expensive query (like pulling all posts for a sidebar every page load).
- Check your software versions: Are you running the latest WordPress core? Latest Shopify theme version? (Shopify might have theme updates available from the theme developer that improve speed). What PHP version is your server on? You can often see this in hosting panel or use a phpinfo file. If it’s below 8.0, it’s worth upgrading.
- Check error logs: Sometimes slow performance is due to code errors or warnings filling up logs or causing retries. An outdated code might throw a lot of warnings on newer PHP – those can slow things if excessive.
- Third-party audits: There are tools or services (and even Google PageSpeed) that estimate if a lot of time is spent in scripting or rendering. If your site has a slow Time to Interactive even after handling images/requests, it might be heavy client-side code (often from a builder or heavy JS theme).
- Test older vs newer: If you recently added a new theme or builder and noticed slowness, that’s a clue. Or if your site used to be faster and over time it got slower without content quadrupling, the platform might need updates or code cleaning.
Examples:
- WordPress theme bloat: A multipurpose theme like Avada or Divi is powerful but can be heavy. These might load multiple mega menus scripts, portfolio scripts, etc. A simple page might end up including 10 CSS files and 10 JS files from the theme. If you compare to a minimalist theme (like “Hello Elementor” with just essential parts, or default theme), you’ll see a stark difference in source code length and file requests.
- Shopify theme inefficiencies: Perhaps you have a theme that isn’t well-optimized: it might not use Shopify’s built-in lazy loading for images, or it might do something non-standard that prevents Shopify’s usual optimizations. If it’s a very old theme, it might not have been updated for performance best practices (like responsive images or minified assets).
- Custom code issues: Suppose a custom e-commerce site where the developer didn’t anticipate growth – on the homepage it queries the database for the 10 latest products, but does so in an inefficient way that doesn’t use an index, making the query take 2 seconds when product count increased. Or the site could be doing synchronous server calls for data when it could cache them.
- Outdated CMS: A Joomla or Drupal site running a version from 5-10 years ago likely lacks speed optimizations and may run slower on modern PHP due to deprecated code. Similarly, an old version of Magento (for e-commerce) is notoriously slower than newer versions which improved performance.
- Old PHP version: If your host still uses PHP 5.6 or 7.0, WordPress will run slower than on 7.4 or 8.0. PHP 8.0+ can give a noticeable boost to WordPress execution times due to engine improvements.
How to fix it:
- Use a lightweight theme or optimize your existing one: If feasible, switch to a more performance-oriented theme. There are many modern themes that prioritize speed (GeneratePress, Astra, Neve, the default WP themes, etc.). If you can’t change the theme entirely, consider stripping out parts of it: disable features you don’t use. Some themes allow you to toggle off certain scripts or components in their settings. If not, a developer can sometimes dequeue scripts/styles that are not needed.
- Optimize page builder usage: If using a page builder, try to limit it to where necessary. For instance, maybe use it on the homepage, but for simple pages (like Contact page), use the default editor to avoid loading builder assets there. Some builders (Elementor) have an optimization setting to only load widgets assets as needed – ensure those are on. Also, keep the builder plugins updated, as they do optimize their code over time.
- Update your platform and software: Always update WordPress core to the latest stable version – each release often has performance tweaks (e.g., improved query efficiency, better lazy loading logic, etc.). Update PHP on your server to the latest supported (ensuring compatibility first). Update any framework or CMS you use. New versions generally run faster and also ensure compatibility with newer technologies.
- Review custom code for inefficiency: This might require a developer’s help. Profile the slow parts: if a specific page is slow, investigate the code path. Perhaps adding a database index, or refactoring a slow loop, can make a big difference. Sometimes just caching a result in memory for the duration of a page build can help (like if you call the same function 10 times, have it store the result first time).
- Remove outdated or redundant code: If your theme or site had some old scripts included (maybe for a feature no longer used), remove them. For instance, maybe the theme had IE9 support scripts or old tracking codes – those could be axed.
- Minimize DOM complexity: Avoid extremely complex layouts if possible. E.g., instead of 10 nested divs for a simple element, simplify the HTML. This is more for theme developers, but page builders sometimes create a lot of nested containers – if you can reduce sections/columns to the minimal needed, do it.
- Load only what’s needed: Implement conditional loading in your theme or code. If a script is only used on one page or template, ensure it’s only loaded there, not site-wide. WordPress allows you to register scripts and enqueue only on certain pages (conditional tags). Similarly for styles.
- Leverage platform optimizations: If WordPress, use the built-in lazy loading for images (don’t disable it unless you replace with better). Use new features like WebP support (if on WP 5.8+). If Shopify, use sections and theme snippets efficiently so as not to duplicate heavy code. Use Shopify’s native image
srcsetby uploading multiple sizes (Shopify auto-generates them). - Consider a rebuild if extreme: In some cases, especially with older sites, the nuclear option is to redesign/redevelop with performance in mind. This could mean converting a heavy page builder layout into lean custom code, or migrating to a better theme, etc. It’s a big step, but if your site is critically slow and other optimizations aren’t enough, a clean, efficient codebase can be transformational.
A leaner, well-coded site will always have an easier time loading fast. It’s like having a car with a lighter frame and a tuned engine – it just performs better. By trimming the fat from your theme and updating your systems, you ensure there are no hidden anchors dragging your site down. Users will get a snappier experience, and you’ll also find it easier to maintain and scale the site in the future.
9. Unoptimized Database and Slow Server-Side Processes
For database-driven websites (e.g., WordPress, or any custom web app with a database), the speed of database queries and server-side logic is crucial. If your database is overloaded, poorly indexed, or bloated, it can slow down every query your site makes, leading to slow page generation. Similarly, any server-side process that is inefficient (like a search function that scans entire tables, or an API call that takes time) will delay the page. This is a more technical reason, but very relevant for larger or older sites. Over time, as you add content, your database grows. If you haven’t optimized it, queries that used to be fine might become slow. Also, leftover data from old plugins (in WordPress, for example) can clutter things. In short, the back-end must be efficient to deliver pages quickly.
How it affects performance:
- Slow database queries increase TTFB: The browser is waiting for the server to deliver the page. If the server is busy fetching data from the database slowly, that initial wait (Time to First Byte) increases. This is often noticed as the site being slow to start loading.
- High server CPU from heavy queries: If a query is not using an index and has to scan a huge table, the database server’s CPU goes up, possibly affecting other operations. Under heavy load, a few slow queries can bottleneck the whole site.
- Content not cached: This ties with caching – if you have good caching, even a slow DB might not affect user-perceived speed for cached pages. But for cache misses or dynamic data (like search results, or logged-in user pages), the database speed matters a lot.
- Locking and contention: In some cases, certain database operations (like writing to the database) can lock tables or rows and slow down other queries. An example: a plugin that logs visitor stats on each page view could be inserting rows constantly and that might slow down other reads if not well handled.
- Bloated data: For WordPress, a classic example is the
wp_optionstable having too many autoloaded options (maybe from plugins that didn’t clean up). On each page load, WP loads those options – if there are thousands of them totaling several MB, that’s a drag. - External calls: If your server-side code calls external APIs (say, to get shipping rates, or to fetch social media counts), those calls can slow down page generation if not done asynchronously.
- Cron jobs and background tasks: If your site runs background tasks (like WordPress cron events for publishing scheduled posts or sending emails), those can sometimes overlap with user requests and consume resources.
How to identify it:
- Use a query monitoring tool. For WordPress, the Query Monitor plugin will show you the slowest database queries on each page and whether any queries are unexpectedly long. It also shows how long the overall database queries took.
- If you have access to your database’s slow query log (MySQL can log queries taking longer than X seconds), check that for any recurring offenders.
- Notice patterns: Is the site slower when performing certain actions, like search or filtering products? That likely points to database query issues in those features.
- For general slowness, check server metrics. If CPU usage is high even with not many users, something ineffient might be running. Possibly run a profiling tool or ask your host if any particular process is eating resources.
- Try a database optimization plugin (like WP-Optimize for WordPress) which can report on overhead or recommended optimizations. For example, it can show if you have thousands of post revisions or trashed items that could be cleaned.
- On custom systems, developers can run profilers or log timings around database calls to find slow spots.
- Test on a copy of the database: sometimes, copying the database and running an optimize (defragmentation) can help a bit. But more importantly, analyze the schema – are there missing indexes? For instance, if a table with 100k rows is often searched by a ‘name’ column and that column isn’t indexed, that query will be slow – adding an index would help.
- If your site has grown (more content, more users) and you never adjusted the back-end, that’s a sign to check DB tuning. It could be that initial settings aren’t enough for current scale (e.g., MySQL config might need more memory allocated).
Examples:
- WordPress database bloat: A WooCommerce store with thousands of orders might see the orders table grow large. If you install a reporting plugin that runs a complex JOIN on orders and products to display sales charts, that might become slow with scale. Or a plugin that tracks user activity might fill up a log table; as it grows, any page that queries that log becomes slow.
- Missing indexes: A real example – a WordPress plugin stored data in a custom table but didn’t add an index on the
post_idcolumn it frequently queried. With 100k entries, a query for a specificpost_idtook seconds. After manually adding an index, it took milliseconds. - Search queries: If your site has a search feature and it’s doing a broad
LIKE '%keyword%'on a content field, that’s slow on large data sets. Many CMSs integrate solutions (like WP can use Elasticsearch or other search plugins for performance). - Shopify (limited DB access): Shopify merchants don’t deal with the database (Shopify’s platform is optimized behind the scenes). However, if you have a lot of products or variants, some operations might feel slower (like the Shopify admin or certain storefront filtering). Usually, Shopify handles this well, but enormous catalogs might need a more powerful search/filter (like an app that uses an index).
- Custom apps: Suppose a custom news site that stores all articles in a database. Initially, 1k articles, all good. Now 50k articles, and the homepage still pulls the 5 latest by doing
SELECT * FROM articles ORDER BY date DESCwithout an index on date – now that’s slow. The fix: add an index on date or limit the fields selected. - WordPress autoloaded options: There have been cases where certain plugins add a lot of entries to the options table marked as autoload (loaded on every page). E.g., some transient cache that didn’t get cleaned. If that autoload data grows too large, every page load drags. You can check
wp_optionsfor largeautoload='yes'data.
How to fix it:
- Optimize and clean the database: For WordPress, use a plugin like WP-Optimize or Advanced Database Cleaner. These can remove unnecessary data like post revisions (limit how many you keep), trashed posts, spam comments, expired transients, etc. Clearing that out can shrink your DB and slightly speed up queries.
- Add missing indexes: This is more advanced, but if analysis shows certain queries are slow due to table scans, adding an index on the involved columns can drastically speed them up. Ensure any custom tables have proper indexing. For WP default tables, most are indexed well out of the box, but plugins’ tables might not be. You might need a developer or DBA’s help here; doing this carefully and testing is important (adding indexes can slightly slow writes, but usually worth it for reads).
- Use caching for expensive queries: If there are parts of your site that run an intensive query (like generating a complex report), cache those results. WordPress has the Transients API to cache data in the DB (though for truly frequent usage, use an object cache like Redis for those). Many plugins do this already (e.g., caching the results of a calculation for a few minutes). For custom code, implement a caching layer so repeated hits don’t always query the DB fresh.
- Upgrade database software or settings: If you run your own server, ensure the database (MySQL/MariaDB etc.) has enough resources. Increase the buffer pool, enable query cache (if applicable to your version), etc. If on shared hosting, you have limited control but you can ask the host if the database server is a bottleneck and if moving to a better plan would help.
- Separate database server: For larger sites, sometimes moving the database to its own server or a more powerful service (like Amazon RDS, etc.) can improve performance, so the web server and DB aren’t contending for the same resources.
- Use updated drivers and techniques: For instance, if your custom code can use prepared statements or more efficient queries, do that. Or if a platform has a newer API that’s faster, use it. Some older code might do things less efficiently – updating it could help.
- Implement search/indexing solutions: If search is slow, consider adding a specialized search service (like Elasticsearch or Algolia) which handles large data much faster than raw SQL
LIKEqueries. There are plugins for WP (ElasticPress, etc.) that integrate Elasticsearch. - Regular maintenance: Schedule routine DB optimizations. Many hosting control panels allow optimizing tables (reindexing, etc.). This can be done maybe monthly for a busy site. It prevents fragmentation.
- Monitor slow queries: Keep the slow query log on (if you manage your server) to catch any new issues early. When you install new plugins or add features, watch if new slow queries appear.
After tuning the database and server processes, the site’s back-end will deliver content more swiftly to the front-end. This means faster first byte times and better handling of dynamic content. Users will feel pages are responding quicker, especially on data-heavy pages (like search results, product categories, etc.). It’s a bit of a technical deep dive, but for business owners, the key takeaway is to ensure your site’s engine under the hood is tuned up, not clogged and grinding.
10. Traffic Spikes and Server Overload
Sometimes the issue isn’t with your site’s code or content at all – it’s sheer volume of traffic or usage. If your website experiences sudden traffic spikes or simply has grown to have high steady traffic without adequate infrastructure, it can become slow or unresponsive. Essentially, your server (or the platform) can only handle so many requests at once. When that limit is exceeded, each request competes for resources, and everything slows down. This often happens during special promotions, viral content, or peak shopping seasons. If you haven’t prepared for it, a big spike in visitors can strain the server CPU, memory, or bandwidth, leading to slower responses for everyone.
How it affects performance:
- Server resource exhaustion: CPU gets busy, RAM gets filled, maybe even I/O (disk or network) is maxed out. In such conditions, the server queues requests or starts using swap memory, etc., all of which drastically reduce speed. A page that normally generates in 0.5s might take 5s under heavy load because the CPU is juggling hundreds of processes.
- Database connections maxed: If too many concurrent requests come in, you might hit max database connections, causing some queries to wait or fail, which the user perceives as slow or error pages.
- Rate limiting or throttling: Some hosts automatically throttle your site if you exceed certain usage (to protect other users on shared hosting). This could manifest as slower responses once you pass a threshold of requests per minute.
- Network congestion: In some cases, if bandwidth is limited, a flood of visitors downloading assets can saturate the network link, slowing down transfers.
- Client-side symptoms: Users might experience pages partially loading or timing out. Or if you have monitoring, you’ll see high response times correlate with high user counts.
- Shopify specifics: Shopify generally scales transparently, but extremely high burst traffic (like tens of thousands of people at once) might cause things like a queue (Shopify has a feature that puts buyers in a queue during very high load events to keep the store stable).
How to identify it:
- This cause is usually identified by context: Did the slowness coincide with a big campaign, a product launch, a viral social media post, or a sale? If yes, likely it’s load-related.
- Check analytics and server logs. If you see a huge spike in visitors or requests at the same time as the slowdown, that’s a clear correlation.
- Your hosting dashboard might show resource usage graphs. Look at CPU, memory, bandwidth around the time of slowness – spiking usage indicates the server was at its limits.
- If using a monitoring service (like UptimeRobot or New Relic), see if they report resource saturation or connection issues during that period.
- In some cases, it might be a specific action – e.g., maybe one user triggered a heavy process (like generating a big report) and that locked up resources. But generally, multiple users is the cause.
- If you consistently approach your hosting plan’s limits (some hosts provide stats), it might not need a “spike” – just high average load making things slow. Then it’s time to scale up.
Examples:
- Black Friday rush: An online store on WordPress (WooCommerce) might be fine day-to-day, but when a Black Friday sale email goes out and 5x or 10x the usual visitors hit the site, it starts lagging. Pages that normally load in 2s now take 8s or even time out. The server’s CPU usage hits 100% due to the flood of PHP processes.
- Viral blog post: A blog post gets shared widely (e.g., on Reddit front page). Suddenly 20,000 people are on the site. If it’s a small server, it just can’t handle that many concurrent requests. The blog might crash or become extremely slow until traffic subsides or the site is cached heavily.
- Limited shared hosting: On a basic shared plan that allows, say, 50 concurrent processes, if you exceed that (maybe with just a few hundred users at once), the host might queue or kill some processes. Users then experience slow loads or 503 errors.
- Shopify flash sale: Typically Shopify is robust, but if you expect, for example, a famous influencer to drop a link and tens of thousands hit at once, Shopify can activate a “waiting room” page to throttle how many add to cart at once to ensure checkout remains stable. That’s an extreme scenario and Shopify handles it relatively well compared to self-hosted solutions.
- Backend batch jobs: Sometimes it’s not public traffic, but if you run a heavy admin operation (like importing a million records, or rebuilding an index) while the site is live, that can hog resources, making the public site slow. So in high-traffic environment, schedule heavy tasks for off-peak times.
How to fix it:
- Scale up your hosting infrastructure: If you anticipate or are experiencing higher traffic regularly, move to a hosting plan or solution that can handle it. For WordPress, that might mean a move from shared hosting to a VPS or dedicated server, or using scalable cloud hosting (AWS, Google Cloud, etc.) possibly via a managed host. Ensure you have sufficient CPU cores and RAM. For extremely high traffic, consider load balancing across multiple servers.
- Implement auto-scaling or load balancing: In cloud environments, you can set up auto-scaling so that when traffic increases, new server instances spin up to share the load. This is more complex but very effective for unpredictable spikes. Load balancers distribute traffic so no one server gets overwhelmed.
- Use a CDN aggressively: We discussed CDN in #2, but in context of high traffic, CDNs can offload a huge amount of the work. If 90% of your static content is served by a CDN, your server deals mainly with generating pages. Combine this with page caching and even dynamic pages might be cached at the edge (e.g., Cloudflare APO or similar), meaning far fewer hits to your server even under heavy traffic.
- Enable caching (if not already): It can’t be stressed enough – if you know a spike is coming (like a sale), ensure full-page caching is on for all pages that can be cached. If your content doesn’t change per user (for blogs, marketing sites), caching can allow a single server to handle an enormous number of hits by serving cached HTML. Without caching, each user triggers resource-intensive processes.
- Queue or throttle expensive operations: If applicable, consider implementing a queue for certain actions. For example, if you have a form that triggers an email and writing to DB, during high load you might queue those tasks to be done gradually instead of immediately, freeing the web request to finish faster. Or temporarily disable some non-critical features under heavy load (maybe that real-time chat can be turned off if it’s overwhelming).
- Consider a “static mode” for emergencies: Some sites under extreme load put up a simplified static version of the site (a slim homepage or a notice) to survive the storm. For instance, if a government site is overwhelmed, they might switch to a lightweight cached page with just essential info. As a business site, you might not want to do that generally, but having a contingency static page (even via Cloudflare Always Online or similar) is possible.
- Upgrade database or other components: If traffic spikes are causing DB issues, maybe move to a better DB system or a managed DB service that scales. Or use read-replicas for databases to distribute the query load (advanced setups).
- Use cloudflare or similar to set up a challenge under extreme: Cloudflare can be configured to present a “checking your browser” interstitial or a captcha if suddenly you get an anomalous surge (in case it’s bots or a DDoS). If it’s legitimate traffic, you wouldn’t want to block them, but sometimes partial measures like challenge for non-human behavior can filter out some noise.
- Inform users or use waiting room if necessary: If you expect insane load (like concert ticket sales scenario), using a waiting room system can at least handle it gracefully by putting excess users in a queue. This might not apply to most business sites except maybe a hype flash sale.
- Plan for peaks: If you know you’ll be on national TV or have a big event, talk to your host in advance. They might offer a temporary boost or give advice. For Shopify Plus customers, for example, they coordinate big events to ensure capacity.
- Testing: Do load testing in advance. There are tools (k6, JMeter, etc.) that simulate heavy traffic. By testing, you can identify at what point your site starts to choke and address that bottleneck (maybe it’s CPU, maybe DB, maybe network).
- Optimize code for concurrency: Ensure your code doesn’t have bottlenecks like writing to a file that could lock under multiple access. Use non-blocking approaches where possible.
The fix for traffic-related slowness is essentially scaling and preparation. It’s about matching capacity to demand. When done right, your site can handle large crowds without breaking a sweat. That means more sales, more pageviews, and a positive experience even when you hit the jackpot of traffic. If you ignore it, though, a spike can lead to a site crash – a missed opportunity and a potentially damaged reputation.